
Market Demand and Market Supply
1) Write short note on Market Demand.
Individual demand for a product is based on an individual’s choice / Preference among different products, price of the product, income etc. Individual demand is nothing but desire backed by individual’s ability and willingness to pay. By summing up the demand of all the consumers or individuals for the product we get market demand for that particular product.
| Price | Demand of Individual A | Demand of Individual B | Market Demand (Demand of Individual A + Demand of Individual B) |
| 10 | 5 | 7 | 12 |
| 20 | 4 | 6 | 10 |
| 30 | 3 | 5 | 8 |
| 40 | 2 | 4 | 6 |
| 50 | 1 | 3 | 4 |
The above table 1A.1 represents demand schedule of individual A, individual B and Market Demand. Same schedule can be represented with the help of a graph.
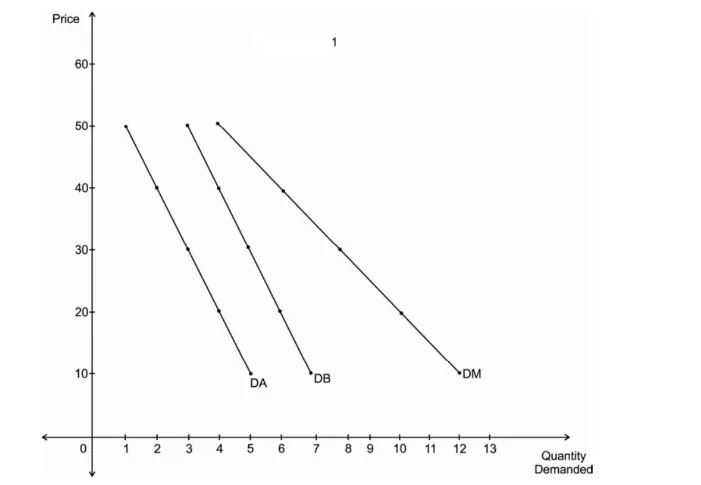
Diagram 1A.1 represents demand curve of individual A, individual B and Market Demand. DA is a demand curve of individual A. DB is the demand curve of individual B. DM is the market demand curve.
All curves are downward sloping indicating negative relationship between price and quantity demanded.
2) Write short note on Market Supply.
Individual Supply is the amount of a product that producer is willing to sell at given prices. By summing up the supply of all the producers for the product we get market supply for that particular product.
| Price | Supply of Producer A | Supply of Producer B | Market Supply (Supply of Producer A + Supply of Producer B) |
| 10 | 1 | 3 | 4 |
| 20 | 2 | 4 | 6 |
| 30 | 3 | 5 | 8 |
| 40 | 4 | 6 | 10 |
| 50 | 5 | 7 | 12 |
The above table 1A.2 represents supply schedule of producer A, producer B and Market supply. Same schedule can be represented with the help of a graph.

Diagram 1A.2 represents supply curve of producer A, producer B and Market supply. SA is a supply curve of producer A.
SB is the supply curve of producer B. SM is the market supply curve. All curves are upward sloping indicating positive relationship between price and quantity demanded.
3) Write short note on Equilibrium Price.
The market price where the quantity of goods supplied is equal to the quantity of goods demanded is called as equilibrium price.
This is the point at which the market demand and market supply curves intersects.
| Price | Market Demand | Market Supply |
| 10 | 12 | 4 |
| 20 | 10 | 6 |
| 30 | 8 | 8 |
| 40 | 6 | 10 |
| 50 | 4 | 12 |
The above table 1A.3 represents schedule of equilibrium price. Same schedule can be represented with the help of a graph to locate equilibrium price. Even in the table itself it is very clear that 30 is equilibrium price as at this price, market demand is equal to market supply i.e. 8 units.
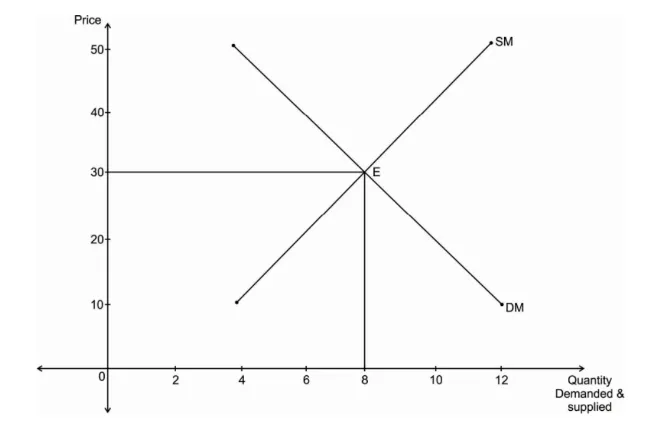
Diagram 1A.3 represents Equilibrium Price. DM is the market demand curve. DM is downward sloping curve indicating inverse or negative relationship between price and quantity demanded.
SM is the market supply curve. SM is upward sloping curve indicating direct or positive relationship between price and quantity supplied. DM and SM curves intersect each other at point E where equilibrium price is 30 and equilibrium quantity demanded and supplied is 8 units.
4) Complete the following table and draw the graph.
| Price | Demand of Individual A | Demand of Individual B | Market Demand |
| 10 | 15 | 10 | ? |
| 20 | 14 | 9 | ? |
| 30 | 13 | 8 | ? |
| 40 | 12 | 7 | ? |
| 50 | 11 | 6 | ? |
6) Write short note on changes in Demand.
Shifts in demand takes place due to changes in non-price factors such as income, population, government policies, tastes, preferences, habits, fashion etc. Whenever there are favourable changes in these factors then the demand curve shifts outward. It is also known as Increase in Demand. Whenever there are unfavourable changes in these factors then the demand curve shifts inward. It is also known as Decrease in demand.
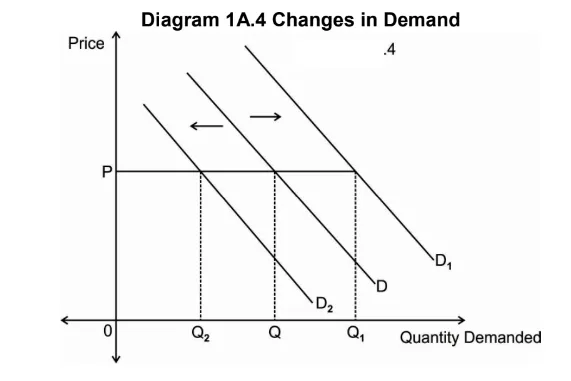
In the above diagram D is the original demand curve. At price P, OQ quantity is demanded. If there are favourable changes in the non-price factors affecting demand then the demand curve shifts outward and becomes D1.
Here we can see that at same price P, now more quantity i.e. OQ1 quantity is demanded. If there are unfavourable changes in the non-price factors affecting demand then the demand curve shifts inward and becomes D2.
Here we can see that at same price P, now less quantity i.e. OQ2 quantity is demanded. Shift from D to D1 is known as Increase in Demand and shift from D to D2 is known as Decrease in Demand.
7) Write short note on changes in Supply.
Shifts in supply takes place due to changes in non-price factors such as cost of production, government policies, state of technology etc. Whenever there are favourable changes in these factors then the supply curve shifts outward. It is also known as Increase in supply. Whenever there are unfavourable changes in these factors then the supply curve shifts inward. It is also known as Decrease in supply.

In the above diagram S is the original supply curve. At price P, OQ quantity is supplied. If there are favourable changes in the non-price factors affecting supply then the supply curve shifts outward and becomes S1.
Here we can see that at same price P, now more quantity i.e. OQ1 quantity is Supplied. If there are unfavourable changes in the non-price factors affecting supply then the supply curve shifts inward and becomes S2.
Here we can see that at same price P, now less quantity i.e. OQ2 quantity is supplied. Shift from S to S1 is known as Increase in Supply and shift from S to S2 is known as Decrease in Supply.
8) What are the effects of changes in Demand on equilibrium?
The market price where the quantity of goods supplied is equal to the quantity of goods demanded is called as equilibrium price. This is the point at which the market demand and market supply curves intersects. Whenever there are changes in demand and supply, position of equilibrium will change.
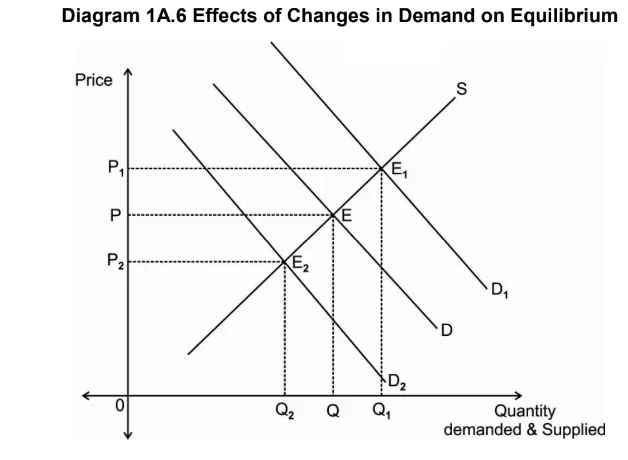
In the above diagram D is the original demand curve and S is the original Supply curve. At equilibrium E, equilibrium price is P and equilibrium quantity demanded and supplied is OQ.
If there are favourable changes in the non-price factors affecting demand then the demand curve will shift outward and become D1. Now the new equilibrium is at E1. At E1, equilibrium price is P1 and equilibrium quantity demanded and supplied is OQ1.
If there are unfavourable changes in the non-price factors affecting demand then the demand curve will shift inward and become D2. Now the new equilibrium is at E2. At E2, equilibrium price is P2 and equilibrium quantity demanded and supplied is OQ2. Thus increase in demand leads to higher price and decrease in demand leads to lower prices.
9) What are the effects of changes in Supply on equilibrium?
The market price where the quantity of goods supplied is equal to the quantity of goods demanded is called as equilibrium price. This is the point at which the market demand and market supply curves intersects. Whenever there are changes in demand and supply, position of equilibrium will change.
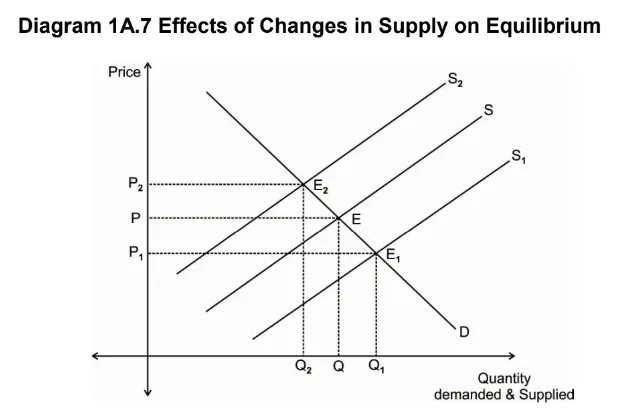
In the above diagram D is the original demand curve and S is the original Supply curve. At equilibrium E, equilibrium price is P and equilibrium quantity demanded and supplied is OQ. If there are favourable changes in the non-price factors affecting supply then the supply curve will shift outward and become S1.
Now the new equilibrium is at E1. At E1, equilibrium price is P1 and equilibrium quantity demanded and supplied is OQ1. If there are unfavourable changes in the non-price factors affecting supply then the supply curve will shift inward and become S2.
Now the new equilibrium is at E2. At E2, equilibrium price is P2 and equilibrium quantity demanded and supplied is OQ2. Thus increase in supply leads to lower price and decrease in supply leads to higher prices.
You can download the Business Economics book pdf – Click here